Cisco FMC – Dashboard Widgets
René Jorissen on February 13, 2017
•
0 Comments
• Tags: #cisco #dashboard #firesight #widget
Some widgets on the dashboard don’t generate graphs after deploying a default configuration of Cisco FireSight Management Center.
The first two widgets, Top Server Applications Seen and Top Operating Systems Seen, are generated after the configuration of a Network Discovery Profile. The configuration of the Network Discover Profile is done via Policies – Network Discovery – Networks. I always configure a Network Discovery Profile to profile all Hosts, Users and Application for the RFC1918 IP address space.

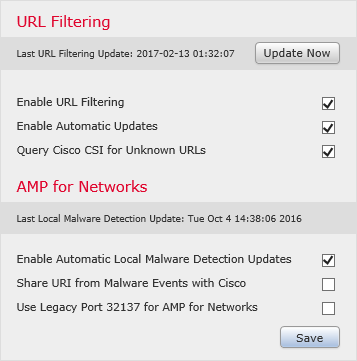
To generate graphs for the URL widgets, you need to make sure that the correct options for the URL filtering service are enable. The URL filtering service configuration is done via System – Integration – Cisco CSI. I use the following settings for URL filtering.
After this you should wait a while (about one hour) to check if the graphs are generated. If you don’t want to wait, you can check the Analysis tab to see if information is gathered and displayed by the Cisco FireSight Management Center appliance.
René Jorissen
Latest posts by René Jorissen (see all)
- MacOS Big Sur and SSLKEYFILELOG - November 23, 2021
- ClearPass, Azure AD, SSO and Object ID - August 12, 2021
- ClearPass – custom MPSK - July 20, 2021